1. m⁶A Data Generation
Sample preparation and m⁶A-seq
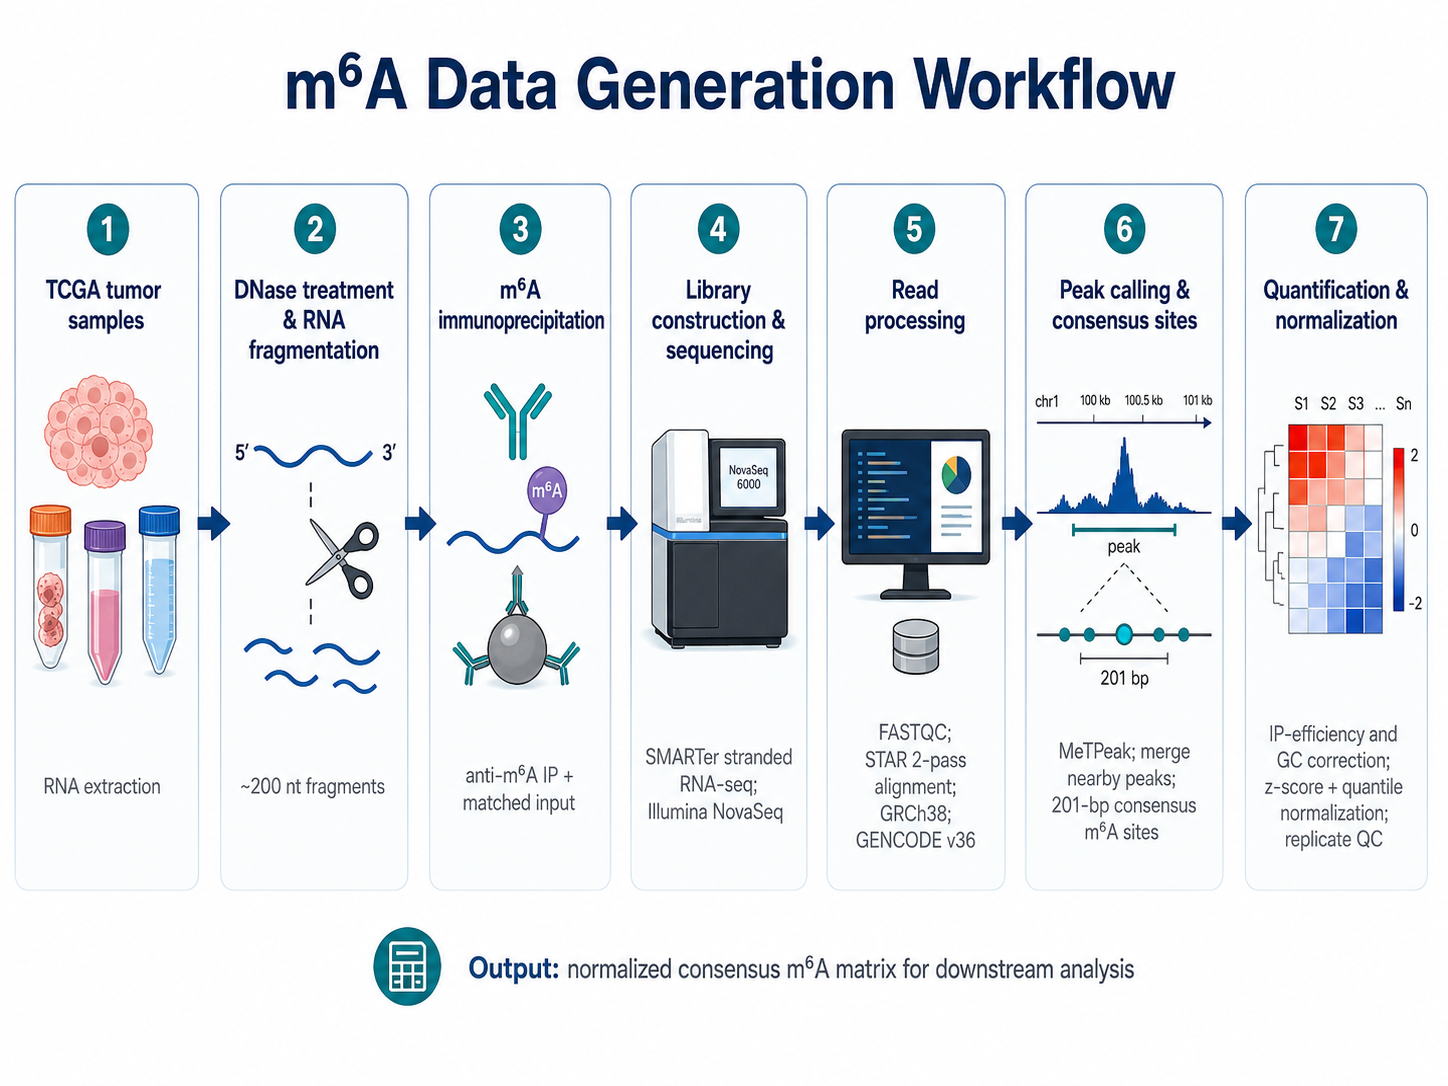
TCGA tissue remaining after RPPA protein extraction was used for RNA profiling. Total RNA was extracted with the Qiagen RNA Plus Mini Kit, and samples with at least 2 µg RNA were carried forward. RNA was treated with DNase I and fragmented to ~200 nucleotides using zinc-based fragmentation.
A small fraction of fragmented RNA was retained as the input control. The remaining RNA underwent immunoprecipitation with an anti-N6-methyladenosine antibody coupled to Protein A/G beads. Enrichment efficiency was assessed by RT-qPCR using SETD7 as a positive region and GAPDH as a negative region.
IP-enriched RNA and matched input RNA were converted into stranded sequencing libraries using the SMARTer Stranded Total RNA-Seq Kit v2 and sequenced primarily on an Illumina NovaSeq 6000.
Read processing and peak detection
Raw reads were quality checked with FASTQC and processed using the standard NCI Genomic Data Commons RNA-seq workflow. Reads were aligned to GRCh38 with two-pass STAR alignment, using GENCODE v36 gene annotation.
m⁶A peaks were called independently for each sample with MeTPeak v1.0.0 by comparing IP and matched input libraries. Peaks were retained when detected in at least 5% of TCGA samples or in at least two samples within a cancer type. Nearby peaks within 100 bp were merged, and each merged summit was extended by ±100 bp to define a 201-bp consensus m⁶A site. Only sites in protein-coding regions were retained.
Quantification and quality control
Consensus sites were compared with m6A-Atlas v2.0. Metagene coverage was evaluated with MeRIPtools, and sequence motif enrichment was assessed with MEME Suite using 10,000 random background sequences.
For each consensus site and sample, methylation abundance was quantified from the paired IP and input data. Samples with more than 20% missing values and sites missing in more than 20% of samples were excluded. Values were corrected for IP efficiency and GC-content bias, then z-score transformed and quantile normalized for downstream analyses.
Technical reproducibility was evaluated by comparing replicate correlations with a null distribution generated from random same-cancer-type sample pairs. Eight non-overlapping pairs were sampled per iteration, and the procedure was repeated 1,000 times.
Core output
| Item | Specification |
|---|---|
| Reference genome | GRCh38 |
| Gene annotation | GENCODE v36 |
| Peak caller | MeTPeak v1.0.0 |
| Consensus site width | 201 bp |
| Primary data product | Normalized site-by-sample m⁶A matrix |
2. RPPA Data Generation
Proteomic profiling of m⁶A regulators
Protein abundance was measured for 15 core m⁶A regulators: ALKBH5, FTO, IGF2BP1, IGF2BP2, IGF2BP3, YTHDC1, YTHDC2, YTHDF1, YTHDF2, YTHDF3, RBM15, METTL3, METTL14, KIAA1429, and WTAP.
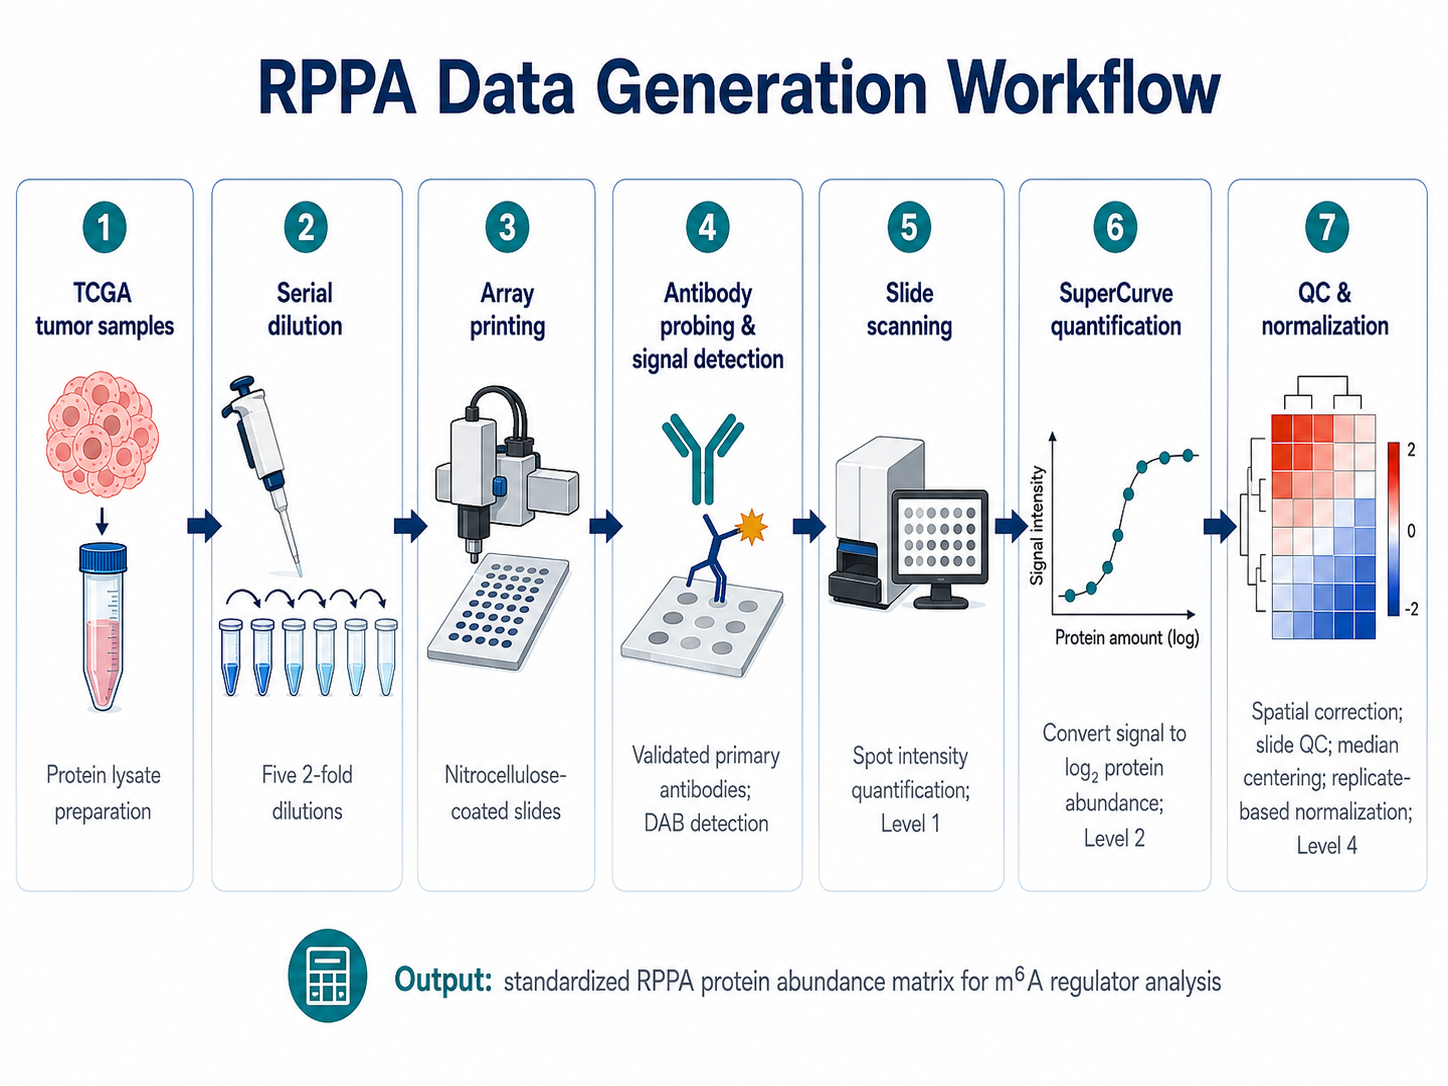
The dataset contains 7,482 TCGA tumor samples across 32 cancer types. Frozen tissues and cell pellets were lysed in RPPA lysis buffer containing protease and phosphatase inhibitors. Total protein was quantified, serially diluted into five two-fold concentrations, and arrayed onto nitrocellulose-coated slides.
Signal detection and normalization
Each slide was probed with validated primary antibodies. Bound antibodies were detected with biotin-conjugated secondary antibodies, streptavidin-HRP amplification, and colorimetric DAB detection. Spot intensities were quantified with Array-Pro Analyzer to generate Level 1 data.
Protein expression was estimated with the SuperCurve method, which fits a non-parametric increasing B-spline to convert dilution-series intensities into log2-relative abundance values (Level 2). Spatial bias was corrected using distributed control spots.
Only slides with a quality-control score greater than 0.8 were retained. When replicate slides were available, the slide with the highest QC score was selected. Values were then bidirectionally median-centered across samples and antibodies (Level 3), followed by replicate-based cross-slide normalization to reduce batch effects (Level 4). The final Level 4 log2 protein abundance values were used for downstream analyses.
RPPA processing levels
| Level | Description → Use |
|---|---|
| L1 | Raw quantified spot intensities — initial signal output |
| L2 | SuperCurve-derived log2 relative abundance — within-slide quantification |
| L3 | Bidirectional median-centered values — sample/antibody normalization |
| L4 | Replicate-based cross-slide normalized values — final downstream analysis |
3. m⁶A Prediction Model
Model objective and training data
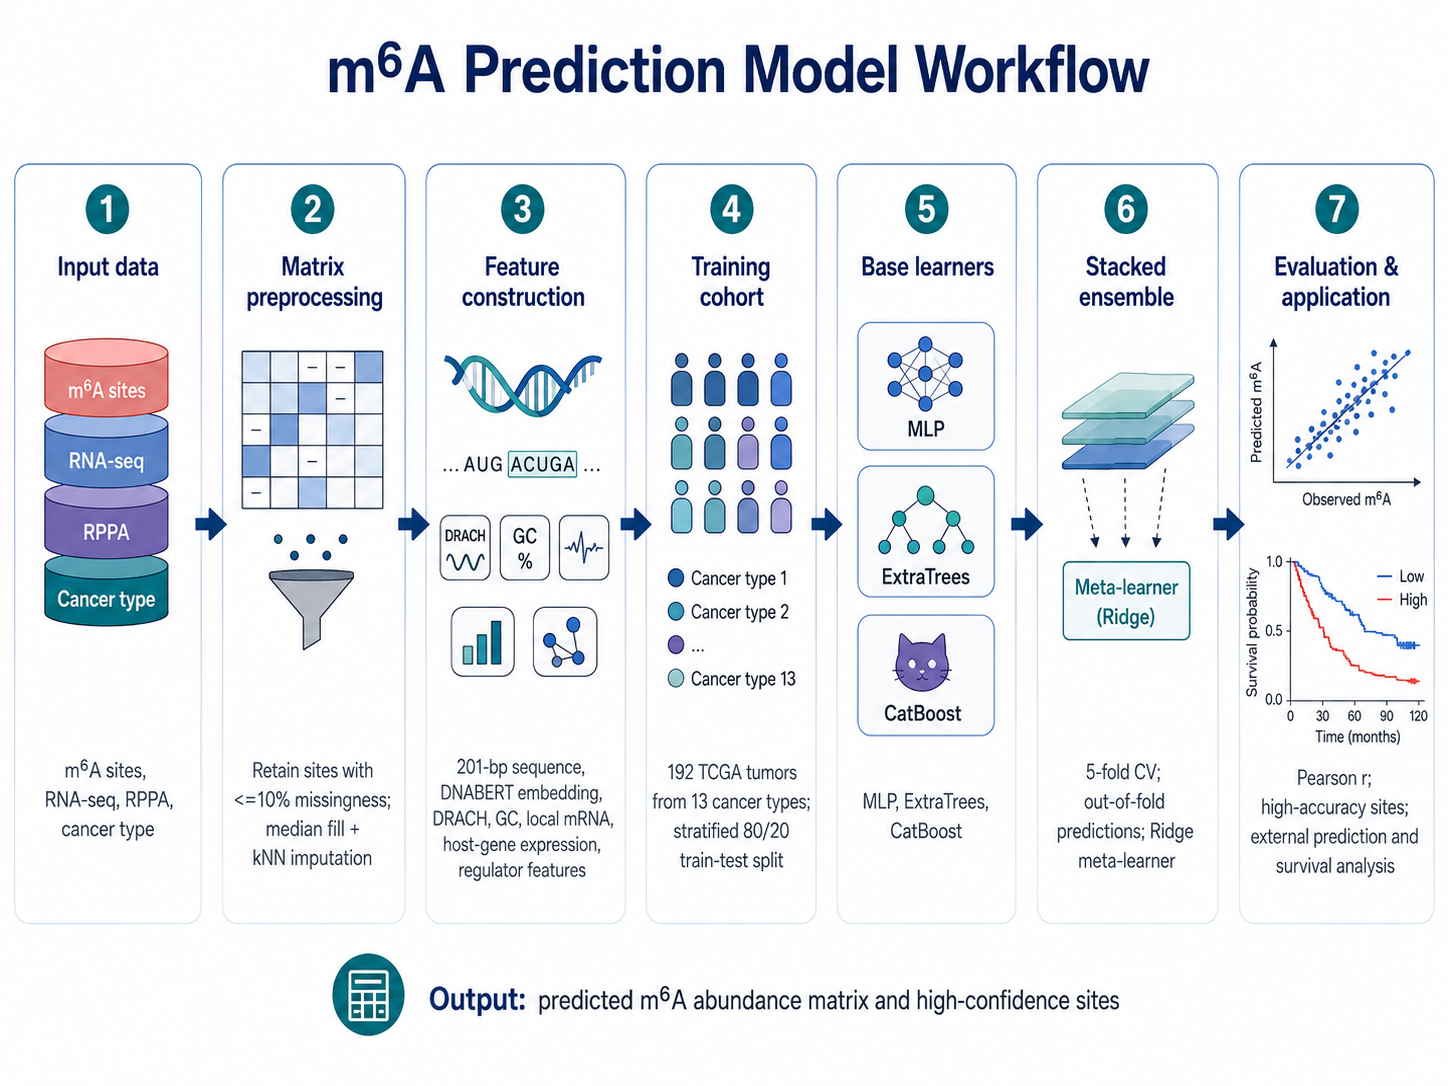
The model predicts quantitative m⁶A abundance for a specific m⁶A site in a specific tumor sample by integrating sequence context, local expression, m⁶A regulator activity, and cancer lineage.
Sites with more than 10% missing values were removed, leaving 12,372 sites. Remaining missing entries were first filled with the site median and then refined with k-nearest-neighbor imputation using k = 5. Modeling used 192 tumors from 13 cancer types, split within each cancer type into 154 training samples and 38 held-out test samples.
Input features
| Feature group | Description |
|---|---|
| Sequence context | 201-bp sequence per site encoded with pretrained DNA-BERT (6-mer); the [CLS] representation gives a 768-d embedding. DRACH motif presence and GC content added as explicit features. |
| Local expression | Per-site RNA coverage from TCGA BAM files (CPM + TMM, log2, z-score), plus host-gene mRNA expression. |
| m⁶A regulators | mRNA expression for 29 known regulators and RPPA total-protein abundance for 15 core regulators, when available. |
| Tissue context | Cancer type as one-hot encoding. |
Ensemble architecture and training
The final predictor is a stacked ensemble with three base learners: a multilayer perceptron, an ExtraTrees regressor, and a CatBoost regressor. Their predictions are combined by a Ridge regression meta-learner.
The MLP contains two fully connected hidden layers with 256 and 128 units, batch normalization, ReLU activation, and dropout of 0.3. It was trained with AdamW and a Pearson-correlation loss. ExtraTrees used 1,000 estimators; CatBoost used 1,500 iterations, learning rate 0.01, and depth 7.
All base learners were trained using five-fold cross-validation. Out-of-fold predictions from the training data trained the Ridge meta-learner, while fold-specific test predictions were averaged before final ensemble integration.
Evaluation and downstream use
Performance was evaluated site by site by the Pearson correlation between predicted and experimentally observed m⁶A levels across held-out test samples; a shuffled-label analysis provided the random expectation. Sites with Pearson r ≥ 0.5 were classified as high-accuracy predictions — 1,640 sites met this criterion.
The trained model was applied to an independent cohort of 3,485 samples from overlapping cancer types, reusing the same feature construction, preprocessing objects, and architecture. Predicted m⁶A levels were then evaluated in Kaplan–Meier survival analyses using within-cancer median splits.
4. Reproducibility and Data Access
Raw sequencing data, BAM files, and normalized m⁶A profiles are intended for release through the NCI Genomic Data Commons. RPPA measurements for the 15 m⁶A regulators are intended for access through The Cancer Proteome Atlas.
Processed m⁶A matrices, predicted m⁶A values, RPPA measurements, analysis scripts, parameter settings, and software-version information are maintained in the project repository: github.com/isyiningz/TCGA-m6A-AWG.