Overview

A TCGA pan-cancer m⁶A resource — measured and predicted m⁶A, m⁶A-regulator proteomics, expression, and mutations — with an analysis agent that queries the data, runs statistics, and plots results on request.

What this platform provides

The resource integrates direct m⁶A measurements (m⁶A-seq), m⁶A-regulator protein abundance (RPPA), transcriptomic, genomic, and epigenomic layers across TCGA tumors, plus a machine-learning model that predicts m⁶A levels for samples without direct measurement. The m⁶A agent lets you ask questions in natural language and returns computed statistics and publication-style figures.

32
Cancer types
15,812
Measured m⁶A sites
226
m⁶A-profiled samples
1,640
High-accuracy predicted sites
3,485
Predicted-cohort samples
15
Core m⁶A regulators (RPPA)

Three data & modeling pipelines

The platform is built on three workflows. See the Documentation for full methods.
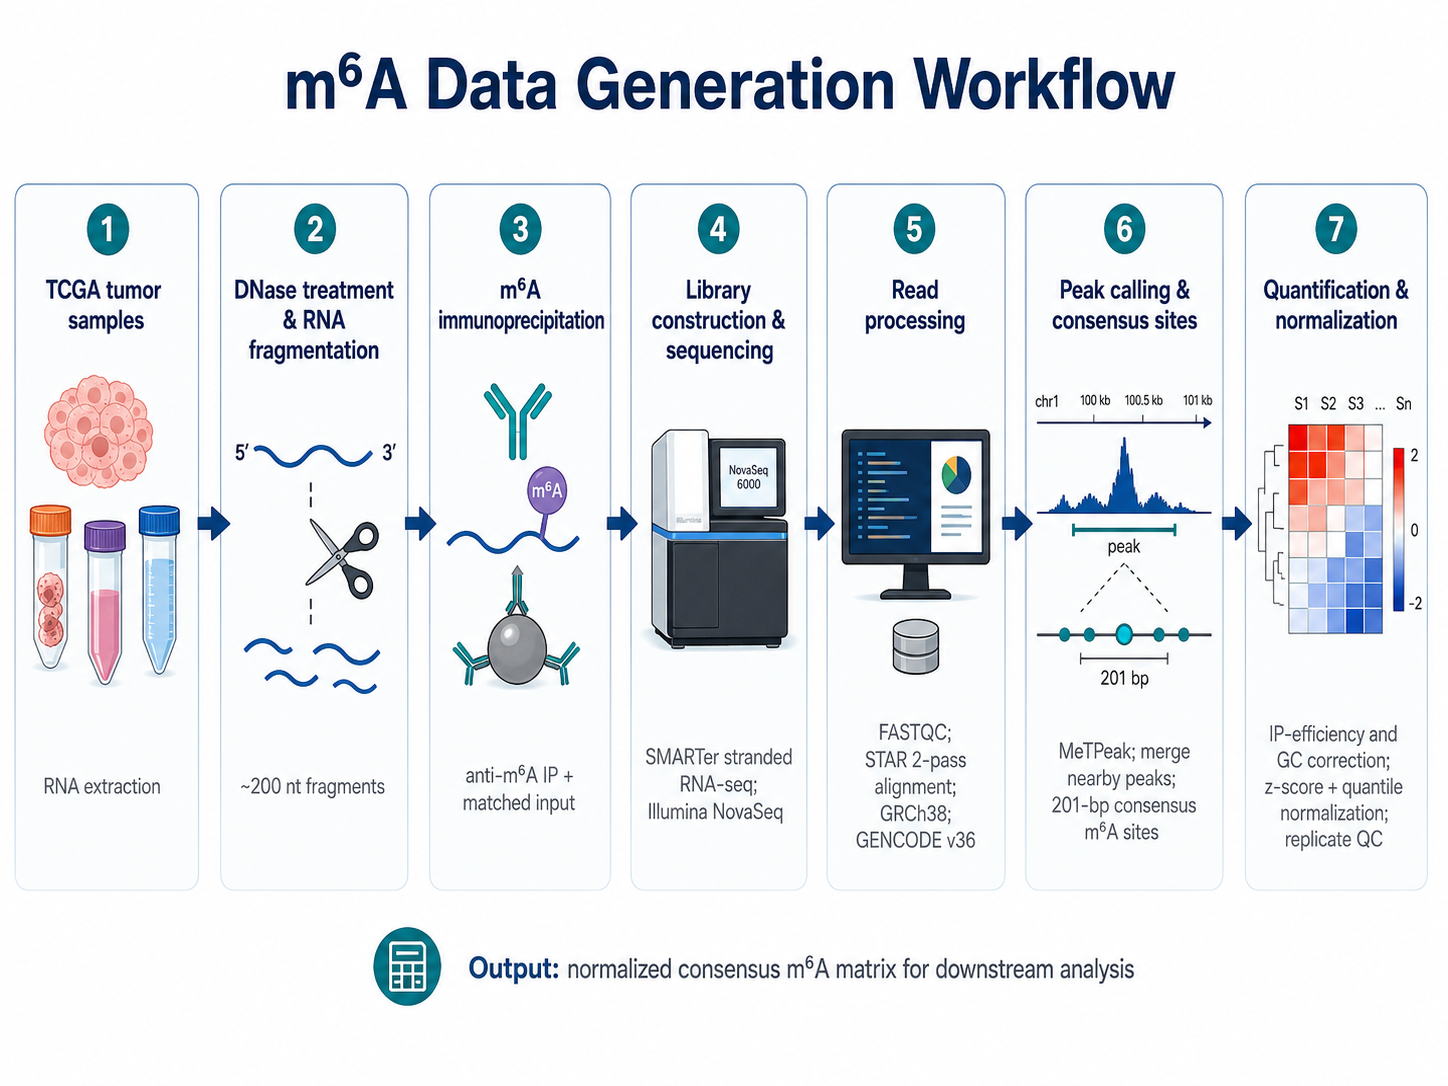
m6A Data Generation Workflow
1 · m⁶A data generation — anti-m⁶A IP RNA-seq, MeTPeak peak calling, and a normalized consensus site-by-sample m⁶A matrix.
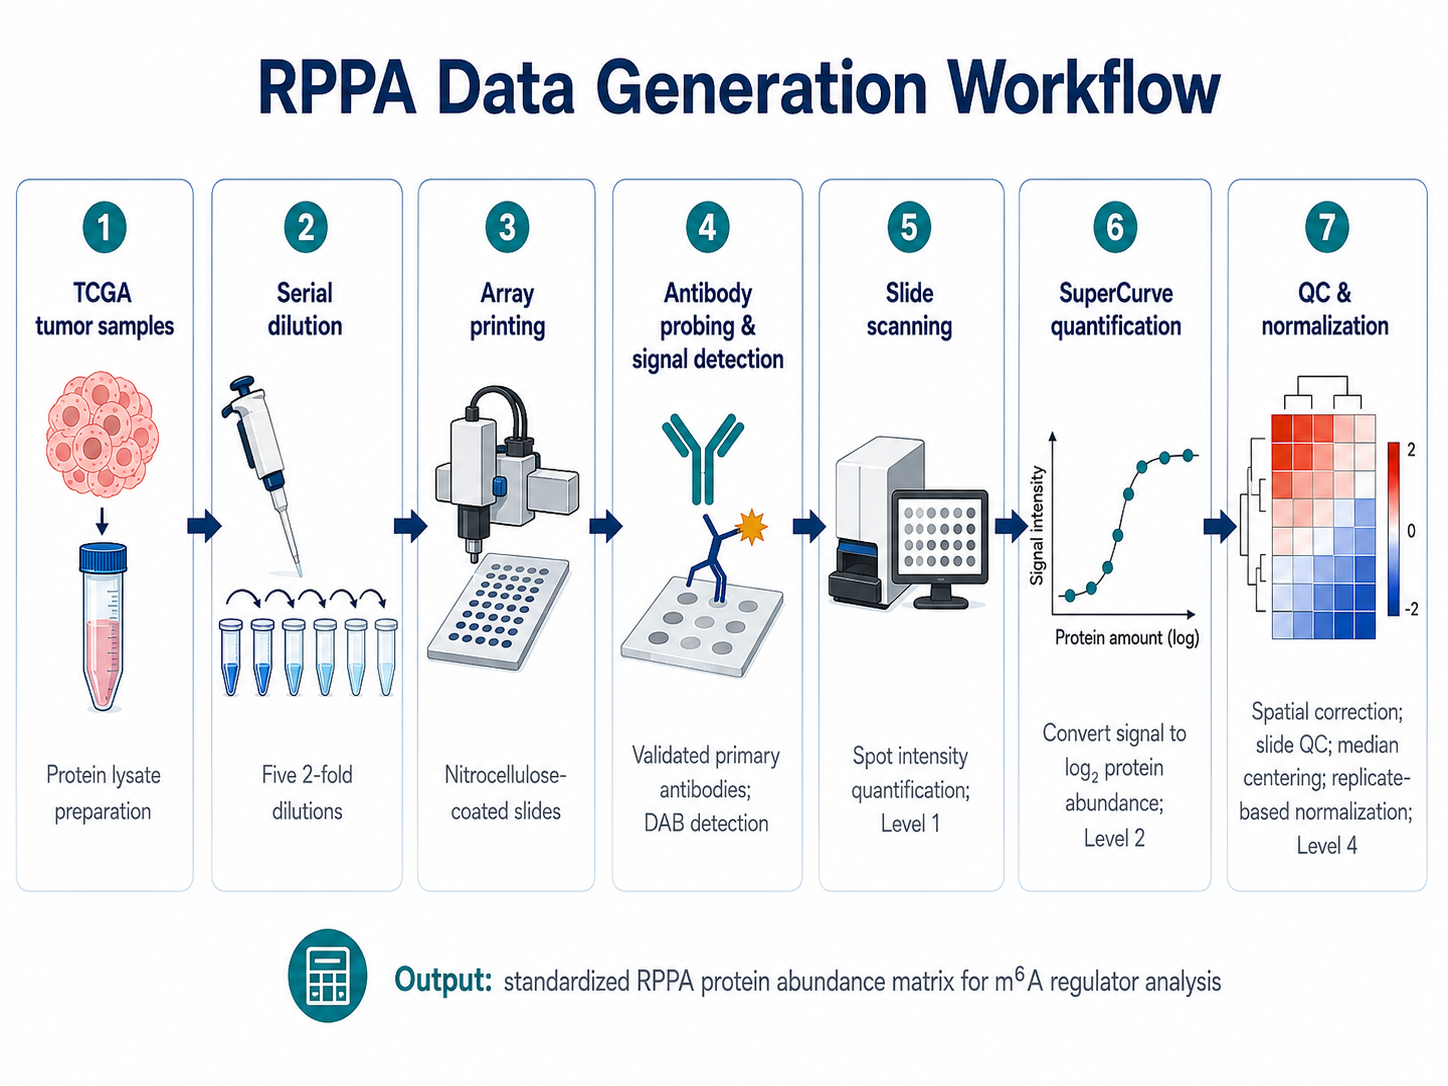
RPPA Data Generation Workflow
2 · RPPA data generation — reverse-phase protein arrays quantifying 15 core m⁶A regulators across 7,482 TCGA samples.
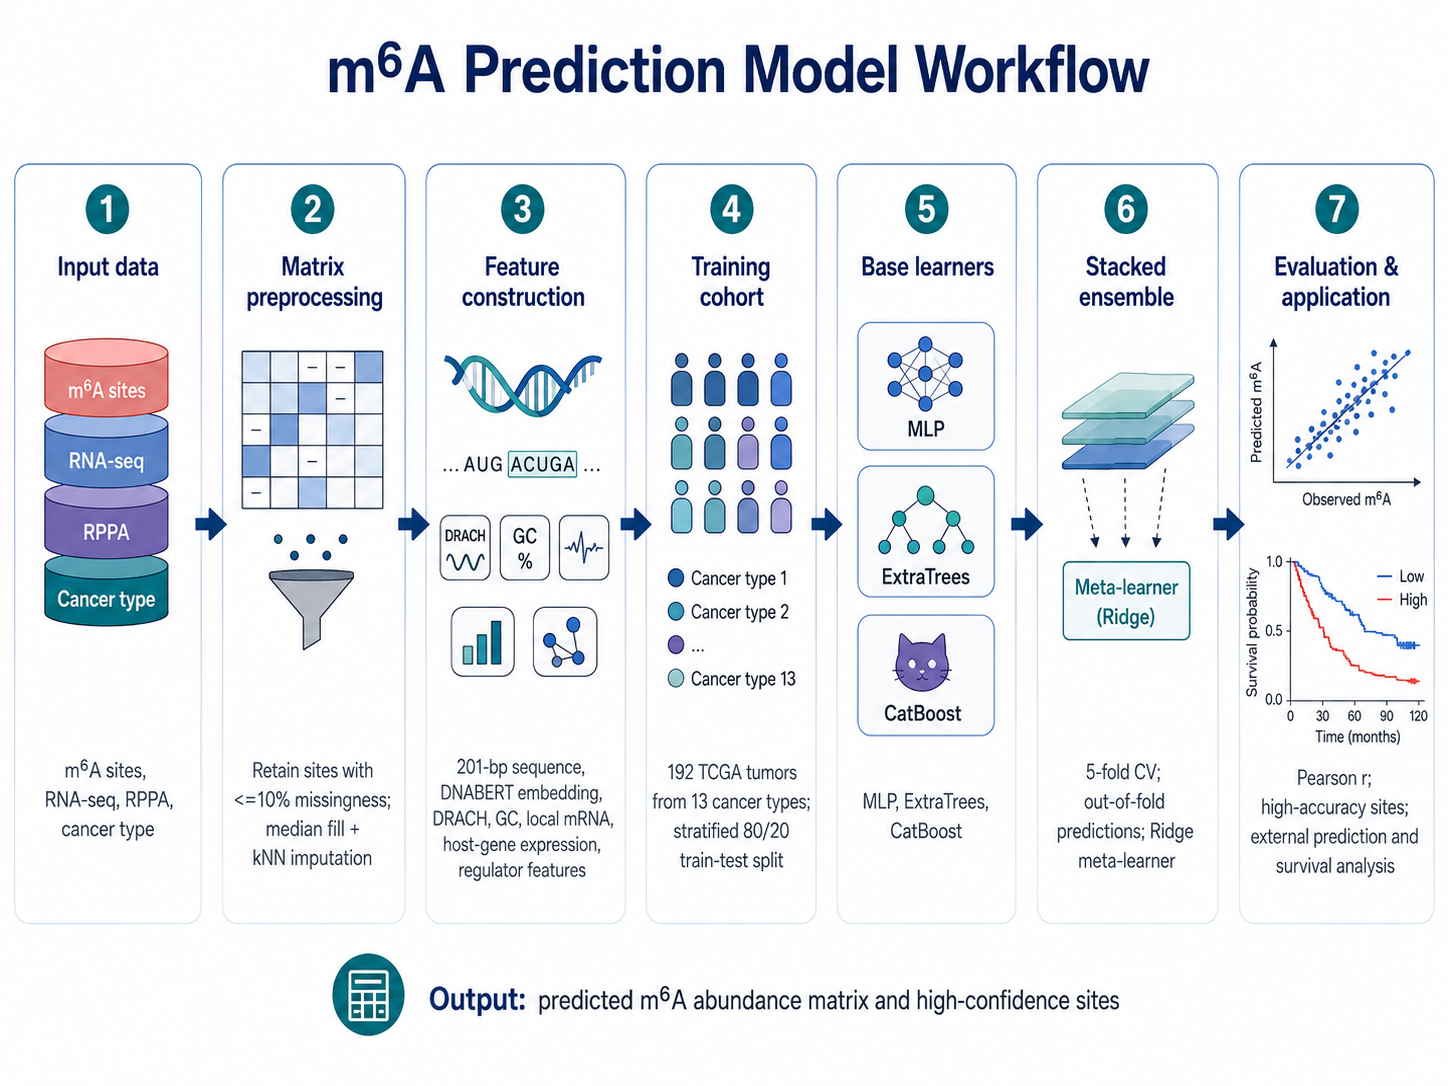
m6A Prediction Model Workflow
3 · m⁶A prediction model — a stacked MLP / ExtraTrees / CatBoost ensemble predicting m⁶A from sequence, expression, regulator, and tissue features.
UT MD Anderson Cancer CenterNational Cancer Institute

This website is developed and maintained by the Han Liang Lab, Department of Bioinformatics & Computational Biology, The University of Texas MD Anderson Cancer Center.

We gratefully acknowledge the Genomic Data Analysis Network and the TCGA m⁶A RNA Methylation Analysis Working Group for their support and contributions.

For academic and non-commercial use only. For other uses, please contact us.